Can you ask Claude to build a Flexmonster pivot table without creating a project, installing npm packages, or even opening an editor? The answer is yes, and it takes just a few prompts to create a pivot table as a Claude artifact.
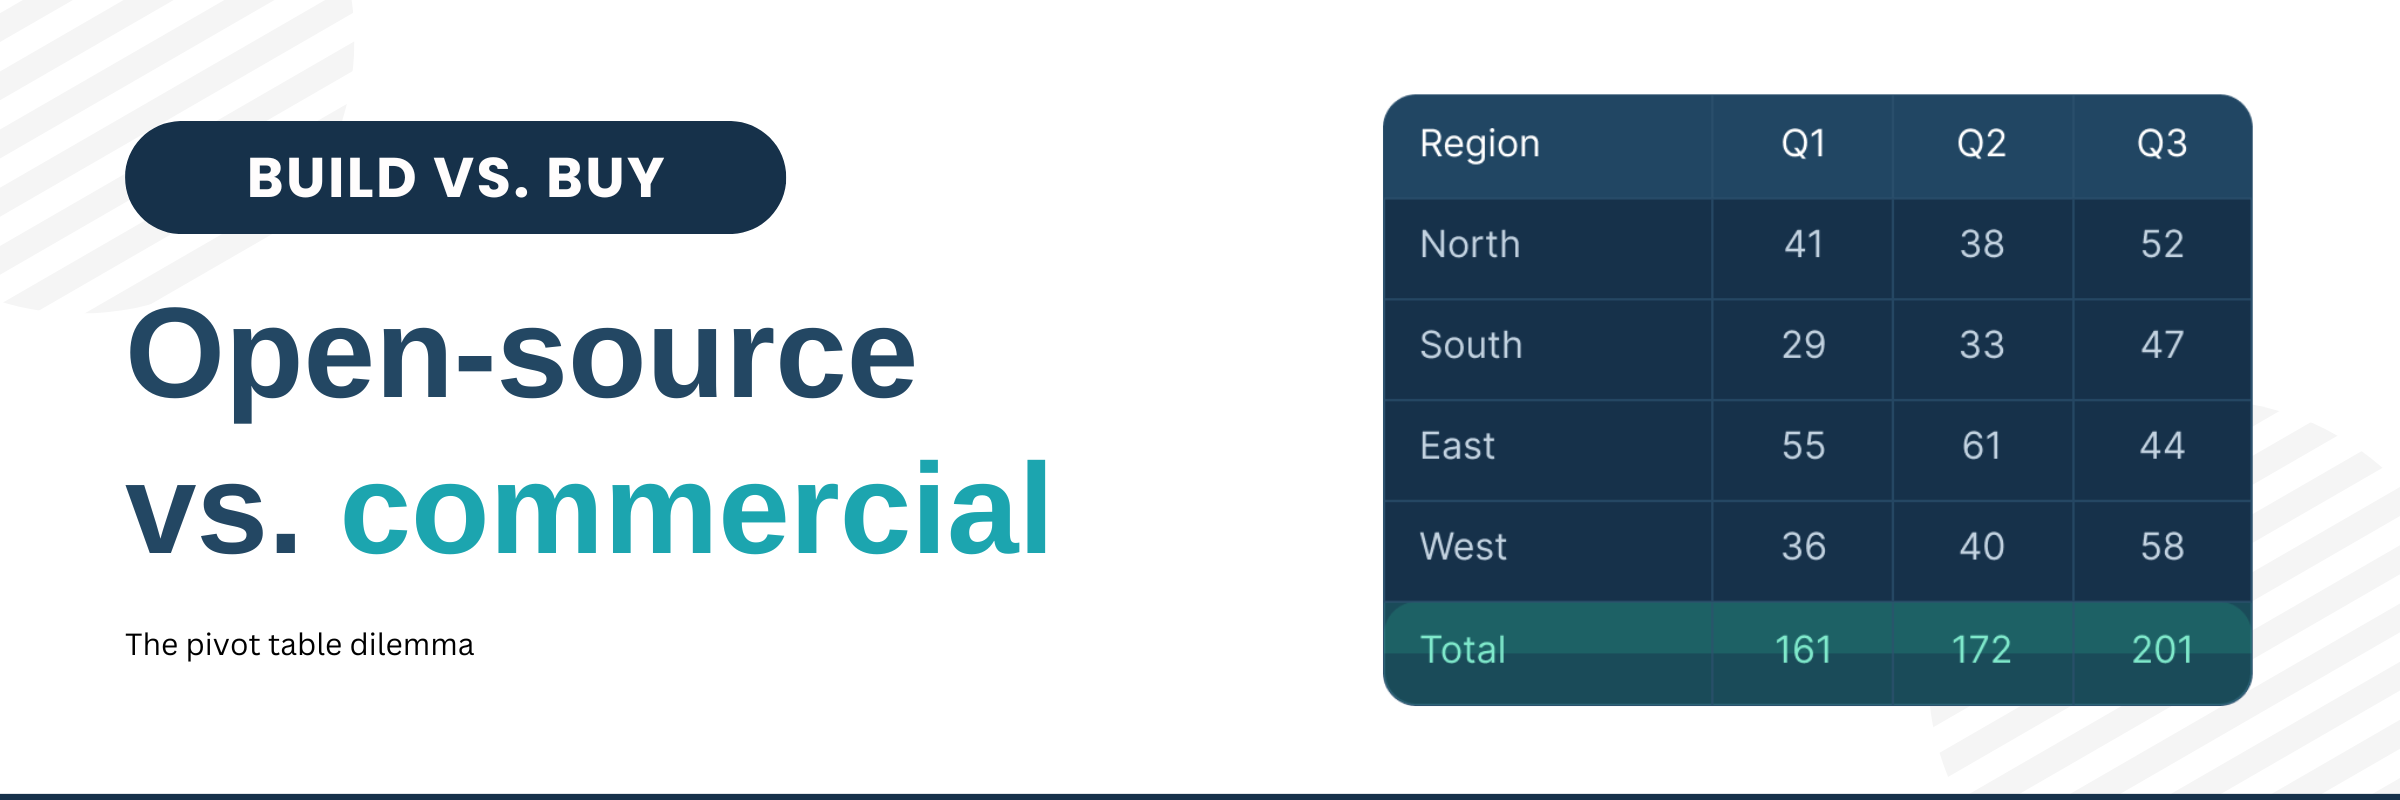
Deciding between open-source and commercial software is one of the toughest calls you make when starting a new web project. There are many different myths and opinions, and each time, the same arguments come back: cost, flexibility, speed, and control.
It's no secret that Svelte has been generating considerable buzz, and our clients have been eager to know if we planned to offer integration. You asked, and we did! We're incredibly excited to share that Flexmonster now provides full integration with Svelte.
For those new to this innovative framework, let's first explore what Svelte is all about and the key factors that have propelled it to such prominence.
Building a React pivot table that remains fast and responsive with millions of rows is one of the biggest challenges in modern dashboard development. Standard data tables often struggle with large datasets, especially when you need grouping, aggregation, and real-time interaction. By integrating a React pivot grid component, you can enable dynamic data grouping, advanced filtering, and Excel-like reporting - all while maintaining performance at scale.
The question of “Which framework is better: React, Angular, Vue?” has sparked countless debates. This trio has become the pillars of frontend development, each with its own community and use cases. You’ll see this question debated endlessly on Reddit, Quora, and tech forums, yet the answer always seems elusive.
We continue to share tips from our Tech team, and in this article, we will discuss more about managing data types in your reports. Dates are essential to any dataset. How you manage, and present date information can significantly impact the insights you derive and prevent mistakes and misunderstandings in data analysis.
Our Tech team continues to share valuable tips on how to get our component to full power and uses all means for that. On our YouTube channel, we have a separate Tips&Tricks playlist.
These videos are designed to provide practical insights and advanced techniques that empower you with the knowledge to tackle complex data challenges and make informed decisions easily.
Here is the list of ✨ 5 main videos from the Tips & Tricks series✨ we think every Flexmonster user should know about!
Today, we delve into the details of reportconfiguration using Flexmonster Pivot Table & Charts. In this video tutorial, we will guide you through the process of configuring a report to suit your specific needs and preferences.
Our Tech team is committed to regularly sharing posts filled with handy tips and tricks. We truly hope these simple hints will spark inspiration and assist you in adjusting it to your reporting.
This time, we'll talk about the style of your pivot grid and how to create a custom pivot table theme.
There are tons of features you can combine in Flexmonster to reach the pivot table functionality you need. On our YouTube channel, we have started a series of videos called “Tips & Tricks” where we share different interesting approaches to maximize your Flexmonster experience.
The last video, Live data refresh/update hack, explains the details of updateData() API call usage. In this blog post, we will delve into the topic and see how it works from the inside.